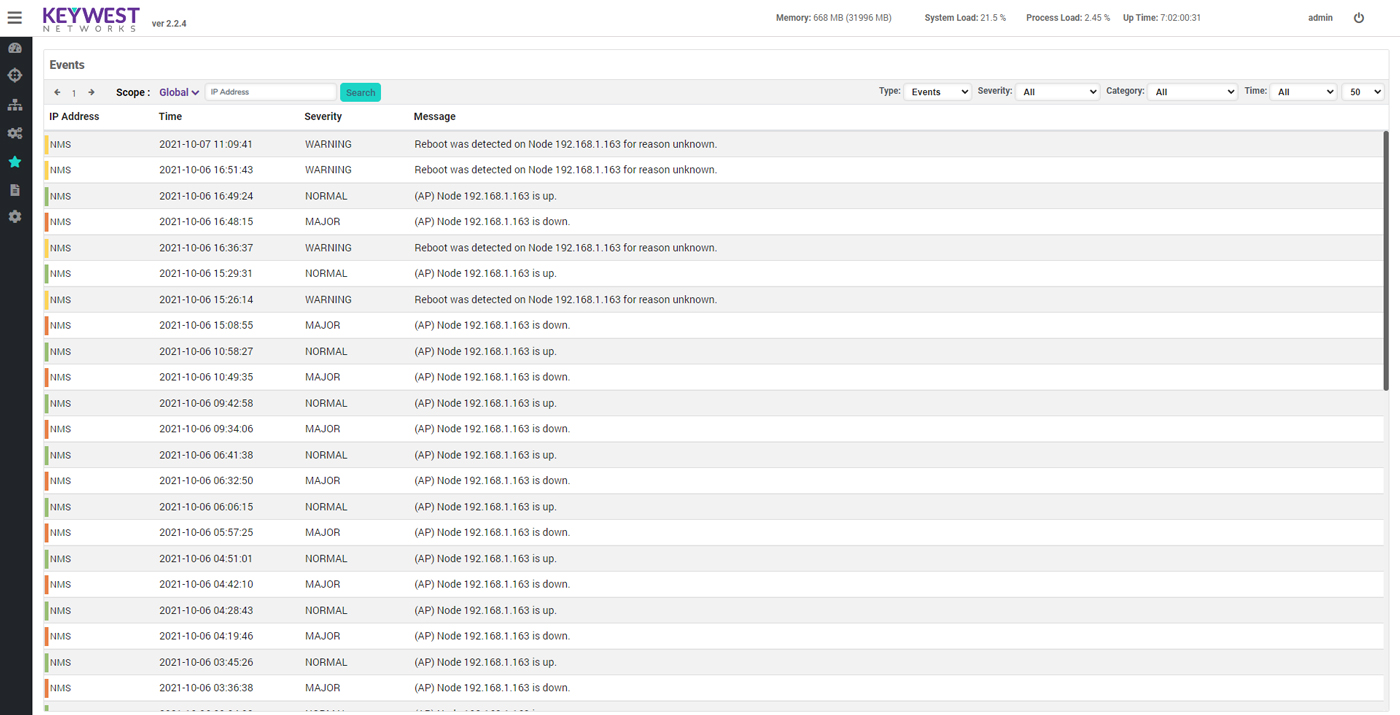
Events section displays all the events generated by NMS internally like device status events (device up or device down) and traps received from the device. An option is provided for displaying syslog messages generated from the device. All the events are displayed in tabular form with details of the event related to IP Address, Time, Severity, Message.
Denotes the address from where the trap is received as message or the event which is generated by NMS on behalf of device like threshold alarms. If the device is generated by NMS directly then the IP Address will be displayed as "NMS". On clicking IP address or "NMS" the navigation takes place to device node view page.
Time
Denotes the time on which the event is generated.
Severity
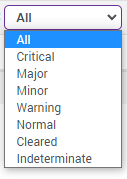
Severity denotes the intensity of the event which helps the user to act based on level. The following are the types of severity ordered based on priority from lower to higher
Indeterminate
- The events for which no priority has been assigneds.
Cleared
- The events whose severity level is high previously and is restored now. for e.g. A threshold alarm like CPU going high has a "Warning" severity and when the CPU comes back to normal has "Cleared" as severity.
Normal
- Events which has the priority set to normal and no action by the user is required like device going up.
Minor
- An event whose priority is set as minor and user needs to consider the event like there has been configuration changes to the device
Warning
- An event whose priority is set as warning and user needs to consider the event like device CPU or memory going up
Major
- Event triggered and treated as a higher priority like device going down
Critical
- An event whose priority has been set as higher than the rest of the events. The user needs to resolve the issue immediately
Message
The event message gives a brief description about the event.
Type Filter
Provides option of filter the data to be displayed in the events table like switch the display of events from syslog’s and events.
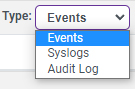
Syslogs
- Syslog are the log events which are forwarded by the device. It usually contains the changes to the configuration or if any errors which are raised in the device. All the log events which are logged in the device can be accessed either in the events section or in the node view -> Monitor - Events section of the device.
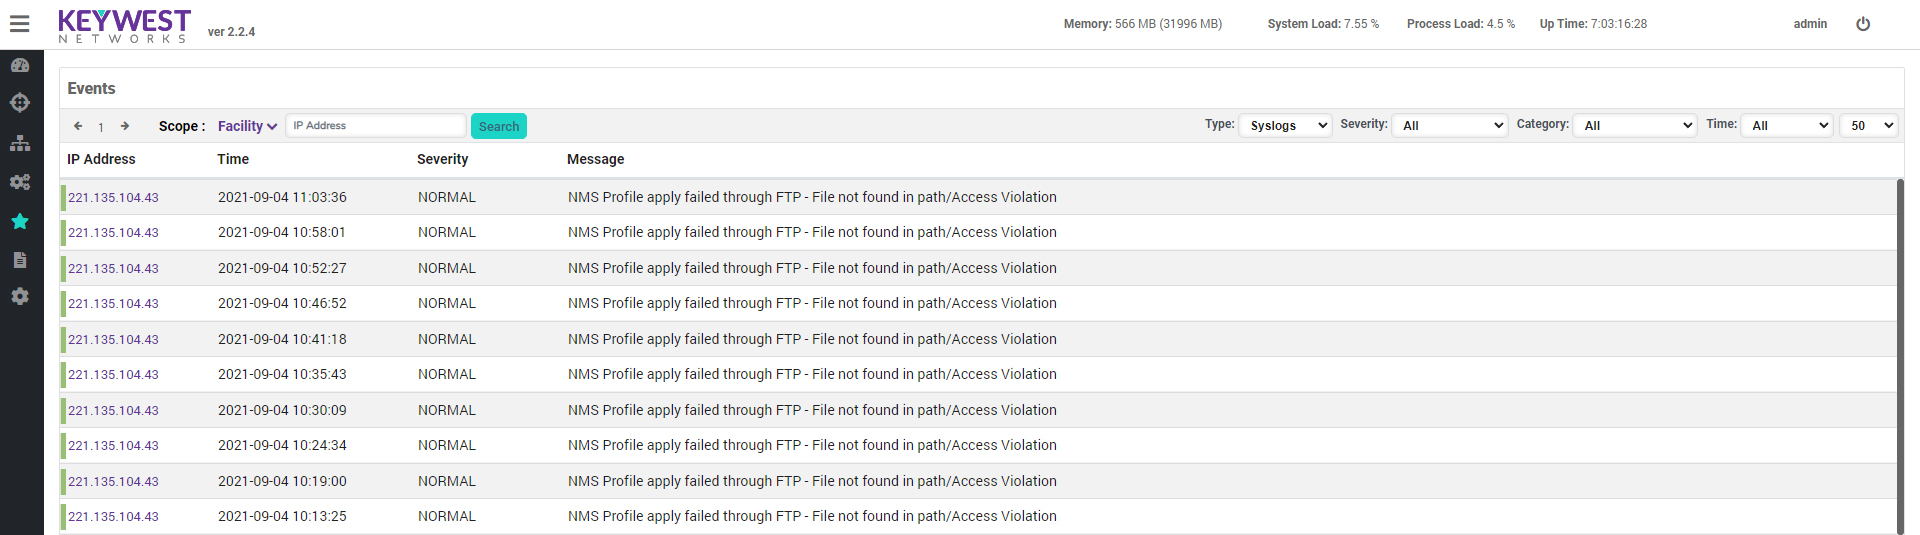
Audit Logs
- Audit logs are the logs which are generated whenever a particular change is made to the configuration of a particular device or any configuration changes are made in the ORNMS server. It contains all activity related to the configuration changes or Discovery initiation or Node modification done by the user right from log in to log-out.
Severity Filter
Provides the option of filter the data based on filter
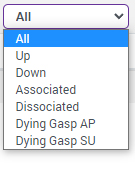
Category
Filtering the events based on category like displaying all device Down/Up events
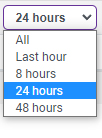
Time
Duration in which the events are generated. current filters provided are Last hour, 8 hours, 24 hours, 48 hours
All
Duration in which the events are generated. current filters provided are Last hour, 8 hours, 24 hours, 48 hours