Updated: September 29, 2021
The dashboard provides a visual representation overview of the current status of your entire network with critical metrics from deployed radios, with real-time performance graphs readily available, administrators can also quickly troubleshoot the problem of devices.
1: Menu
Icon | Description | ||
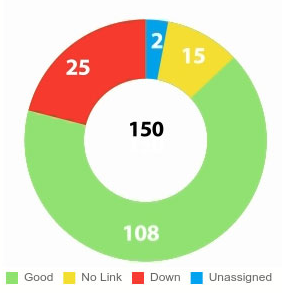
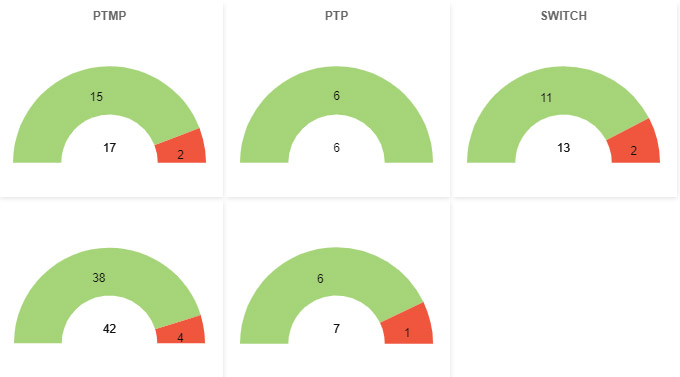
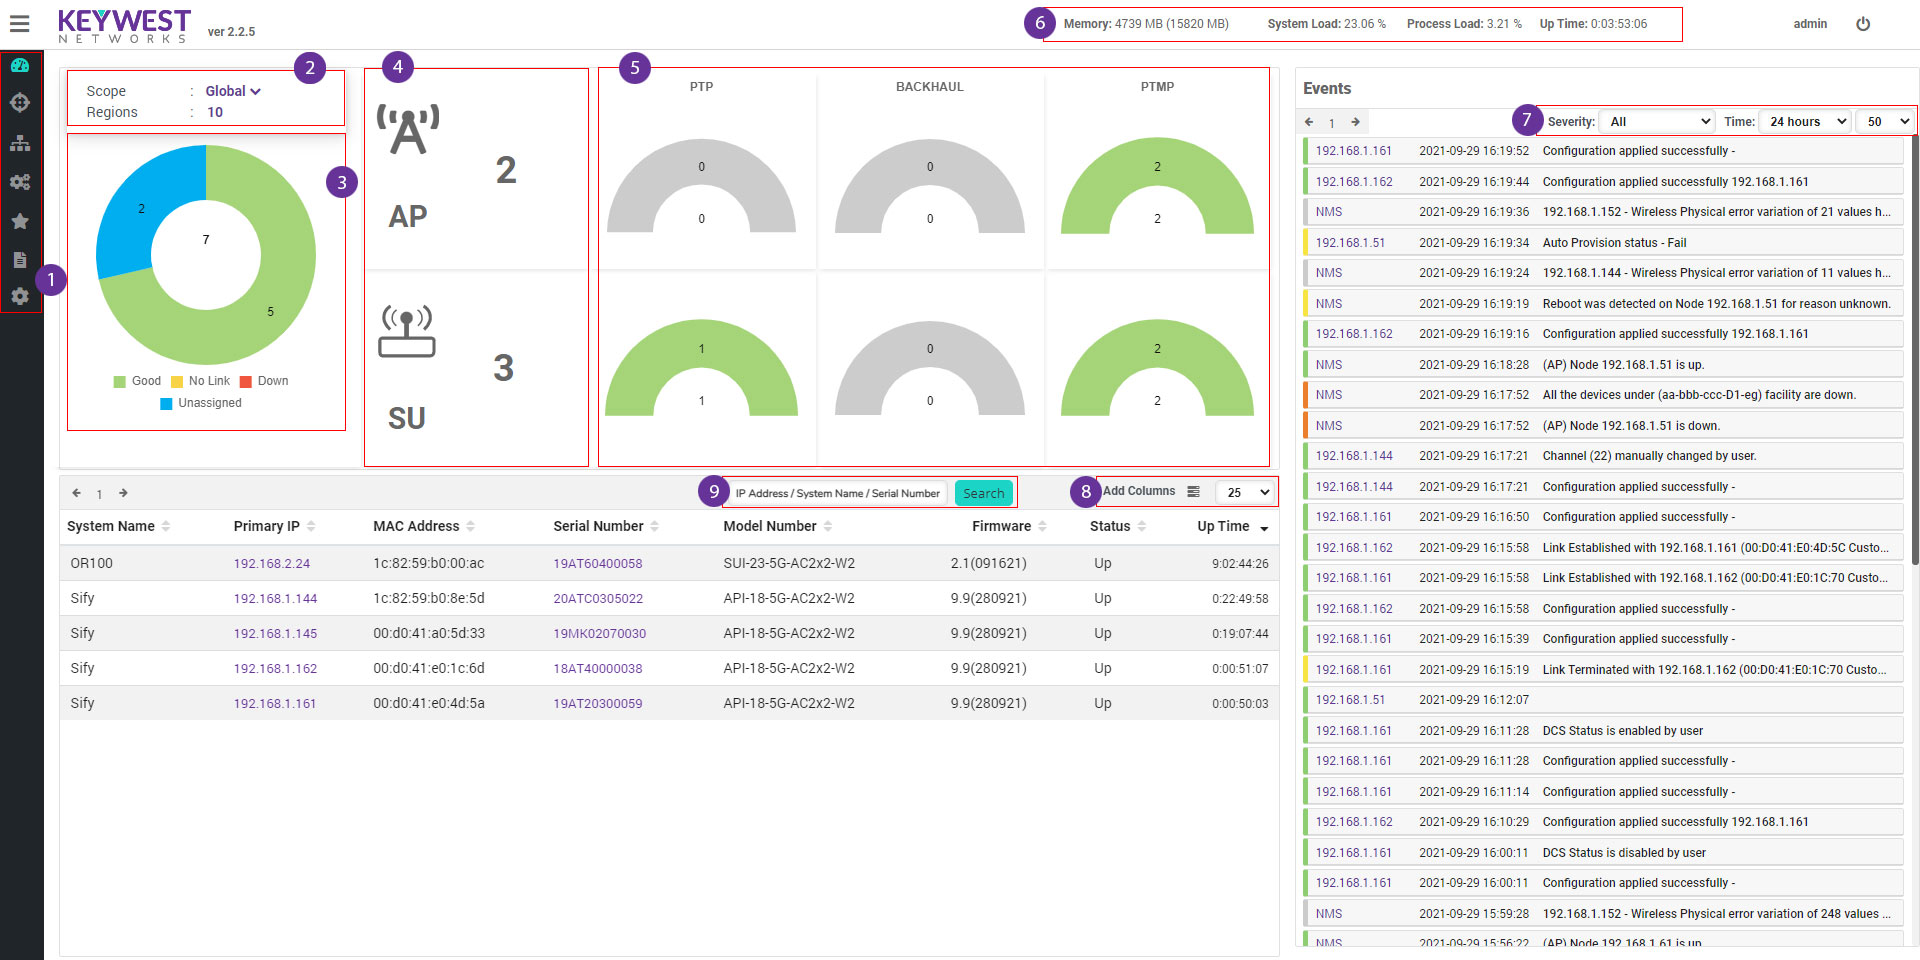
Dashboard The dashboard shows the overall status of the entire network in real-time with the help of graphs and alerts and helps the administrator to analyses the status of the device. |
|||
Discovery: Discovers all the available devices in the networks. There are three types of discovery: By Ip Address, By IP Range, and by uploading defined IP address in the form of .csv file. |
|||
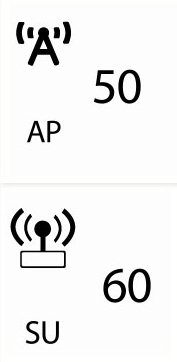
Topology It shows the hierarchically view of devices in tree structure. Devices are listed in the form of Global->Default Region -> Default Location -> Default Facility -> AP -> SU. Please refer Topology for more details |
|||
Configuration A user can create profiles make changes related to IP address, VLAN configuration change and basic configuration changes related to 5Ghz and 2.4Ghz radios |
|||
Events Events and log messages which are generated either by ORNMS or the traps which are generated by devices, when an event occurred in the device. |
|||
Settings Configuration related to the server are listed in “Settings”. |
2: Scope Filter
ORNMS provides the option of grouping the devices based on the location under which they are installed. The current hierarchy of ORNMS is Global > Region > Location > Facility. A new device which is discovered is placed under a facility. A Location may contain more than one facility. Similarly, a Region contains more than one Locations. All the regions come under Global group which is the base group. Scope filter provides the option of filtering network based on the location/facility in which the devices are installed. Based on the filter selection the devices are filtered and only those devices which come under the selected location/facility data is visible in the dashboard section. All the other component data except the “Overall Status” are filtered based on the selection. Scope filter contains “Global”, “Region”, ” City”, “Location”, “Facility” and “Base Station” options. By selecting.
Global
By selecting “Global” filter, the data is filtered globally, the network status and event section provides information of all the devices.
Region
By selecting “Region” filter, the data is filtered based on the region filter selection. One can select either a single region or multiple regions based on the created regions.
City
By selecting “City” filter, the data is filtered based on the city filter selection. One can select either a single city or multiple cities based on the requirement.
Location
By selecting “Location” filter, the data is filtered based on a Location or list of locations
Facility
By selecting “Facility” filter, the data is filtered based on a Facility or list of facilities
3: Overall Status

“Good”
Indicates the count of the devices which are currently active which was shown green in color.
“No Link”
Status explains about the devices which are currently in “AP/BSU” radio mode and does not have any SU’s linked to them. which is shown in yellow color
“Down”
Section contains the count of devices currently down. It means that no response is received from a particular device due to the device may be either powered off or not connected to the network. which is shown in red color.
“Unassigned”
Status explains about the devices which are currently in “AP/BSU” radio mode and does not have any SU’s linked to them. which is shown in yellow color
4: Radio Type
The overall count status of the radio types (AP / SU) of the entire network.

5: Link Type
The picture shows the overall status of the radio Link Type of entire network Ex: PTP, Backhaul, PTMP.

6: Server Status
The below picture shows the completed details of the memory, system load, Process load, Server uptime

7: Events
Event Log definition depending on severity
Events | Description | ||
Critical | An event whose priority has be set as higher than the rest of the events and the user needs to consider resolving the issue immediately. | ||
Major | Device Down | ||
Minor | An event whose priority is set as minor and user needs to consider the event like there has been configuration | ||
Warning | An event whose priority is set as warning and user needs to consider the event like device CPU or memory going up | ||
Normal | Events which has the priority set to normal and no action by the user is required like device going up. | ||
Cleared | The events whose severity level is high previously and is restored now. for eg. A threshold alarm like CPU going high has a "Warning" severity and when the CPU comes back to normal has "Cleared" as severity | ||
Intermediate | This event denotes with no priority assigned | ||
All | All the events are listed without filtering based on severity. |