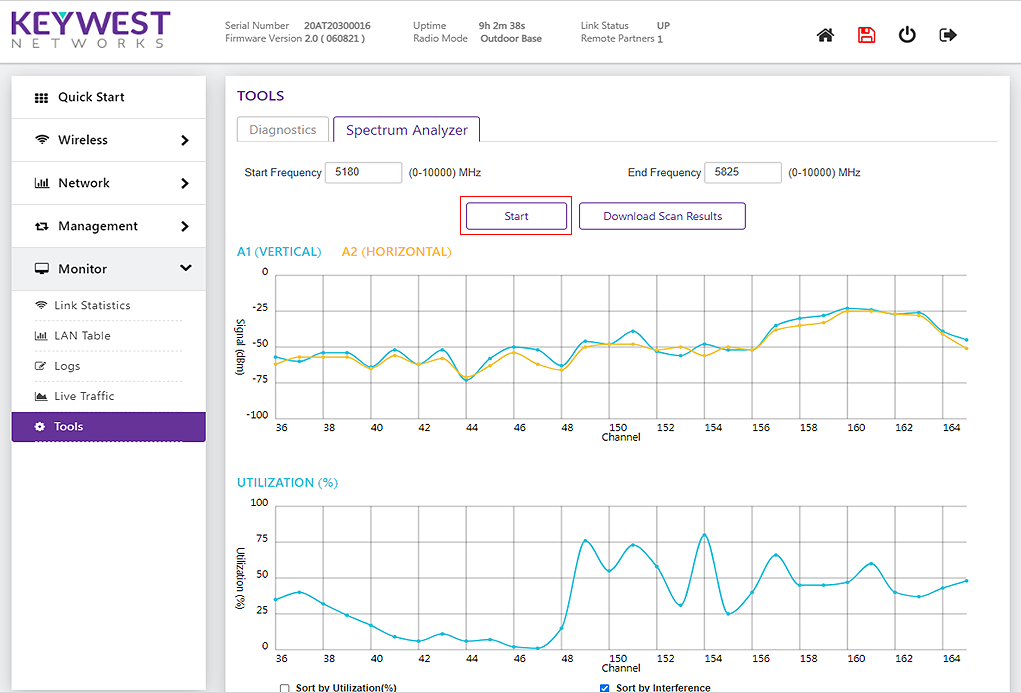
Navigation: To view the Spectrum Analyzer, click Monitor> Tools > Spectrum Analyzer
Step1:
Enter the start and end frequency for a specified scan time and Click Start button to run the spectrum analyzer.
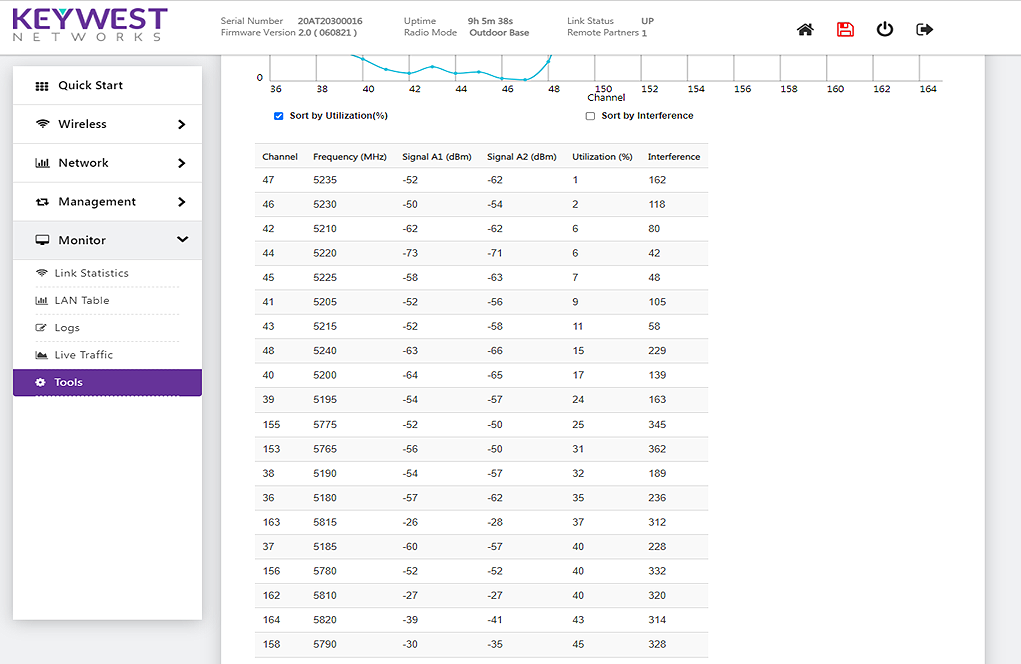
User can select the sorting options in order to sort the values based on Utilization or Interference

Step2:
Stop the Spectrum Analyzer button. The results will be displayed in a graph.
A1 Vertical shows signal strength received on antenna A1 at each frequency.
A2 Horizontal shows signal strength received on antenna A2 at each frequency.

Step3:
User can select the sorting options in order to sort the values based on Utilization or Interference and also he can download the scan results by clicking download button.